Product development trends in 2026: AI, compliance, and operational efficiency

Why 2026 marks a turning point in product development
Digital product development in 2026 follows new principles. High capital availability, tolerance for extended experimentation, and prioritization of velocity over efficiency defined strategy during 2021–2022. Organizations now evaluate products based on operational readiness, financial sustainability, and the ability to support real-world use at scale.
This transition reflects changes in capital allocation, technology assessment criteria, and technical decision-making processes. Products demonstrate stability, integration with existing infrastructure, and predictable behavior from initial deployment. The factors driving this transition are structural and directly influence product scope, architecture, and delivery priorities.
Production-ready systems define expectations for digital product development
The baseline expectation for digital products has moved to operational reliability. Products entering the market are measured by their capacity to integrate smoothly, scale predictably, and operate without introducing technical debt or maintenance complexity.
This expectation applies across categories. In enterprise software, products align with existing IT governance, comply with security standards, and provide clear upgrade paths. In consumer-facing applications, users anticipate consistent performance, transparent data handling, and interfaces that function reliably across devices and connection conditions.
The distinction between pilot-phase technology and production-grade systems has become clearer. According to McKinsey's 2025 State of AI report, 88% of organizations use AI in at least one business function, while 7% have scaled AI across their entire organization. This gap illustrates a pattern: widespread adoption at the experimental level, with limited success transitioning to enterprise-wide, production-ready deployment.
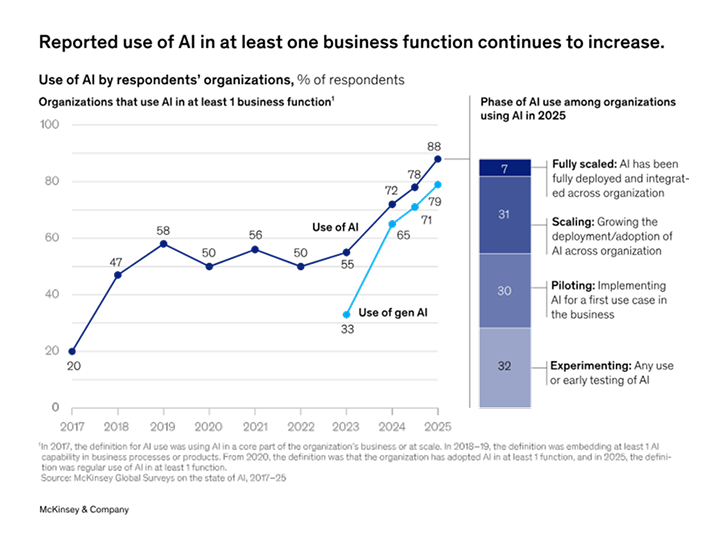
The reasons for this gap are technical and organizational. Many early implementations lacked the observability, governance, and fallback mechanisms required for sustained operation. Products built for demonstration or pilot use often cannot support the load, error handling, or integration complexity required in production environments. Organizations evaluate products on their ability to operate reliably at scale from day one.
This affects how products are architected. Scalability, monitoring, and disaster recovery are embedded into initial design decisions. Products that require significant rework to reach production stability face longer adoption cycles and higher skepticism from technical evaluators.
Financial accountability drives product architecture and delivery decisions
Capital availability has tightened. The tolerance for products that require extended validation periods or unclear paths to profitability has decreased. Investment patterns reveal a preference for companies demonstrating operational efficiency and near-term revenue potential.
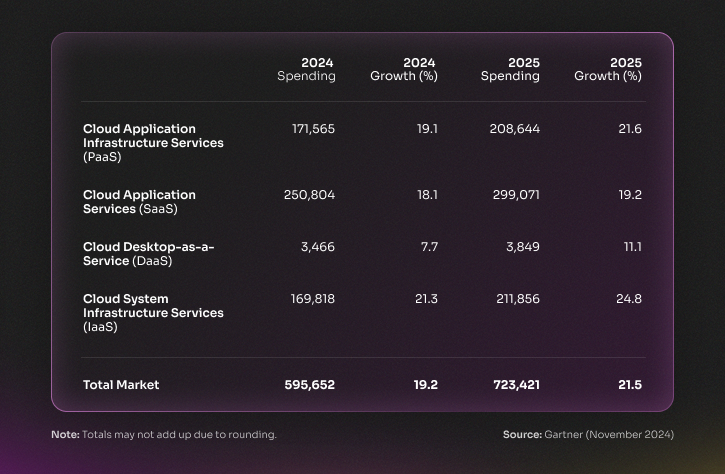
Global cloud spending reached $723.4 billion in 2025 according to Gartner, representing a 21.5% increase from $595.7 billion in 2024. Industry research indicates that 28–35% of cloud resources remain idle or underutilized. Companies implementing structured cost optimization programs achieve 25–30% reductions in monthly cloud expenditure. FinOps practices have moved from optional to standard, with expectations that 75% of enterprises will adopt formalized cloud financial management by 2026.
For product teams, this creates more deliberate scope decisions. Features are evaluated by user value, implementation cost, ongoing maintenance burden, and impact on operational complexity. Products that introduce unnecessary dependencies, require specialized infrastructure, or create long-term technical debt face resistance during procurement and adoption cycles.
Product architecture directly influences these costs. Systems designed without attention to resource efficiency, observability, or rightsizing contribute to operational expenses that compound over time. Organizations place emphasis on total cost of ownership. Products demonstrate functional value and operational cost discipline.
Buyers prioritize reliability and integration over feature velocity
User expectations have evolved alongside technical and financial constraints. Organizations purchasing enterprise software place weight on how a product integrates with existing systems, how it handles failure scenarios, and whether it introduces points of fragility into workflows. Feature velocity has become secondary to operational predictability.
This is evident in SaaS market behavior. Companies achieving strong net revenue retention rates (115–125%, indicating robust upsell and expansion) align pricing models with customer outcomes and demonstrate measurable operational value. Usage-based pricing models have gained traction, growing from 45% adoption in 2021 to 61% by 2025 among SaaS companies. This pricing model succeeds because it ties cost directly to realized value, reducing the perception of waste that contributes to subscription fatigue.
Integration capability has become a procurement requirement. Products provide well-documented APIs, support standard authentication protocols, and enable seamless data exchange with adjacent tools. Organizations operate within complex technology stacks. Products that require manual workarounds or custom middleware face adoption friction.
Reliability extends beyond uptime. Users expect products to handle edge cases gracefully, provide clear error messages, and support rollback or recovery mechanisms when updates introduce issues. In regulated industries such as healthcare and finance, these expectations are reinforced by compliance requirements that mandate auditability, traceability, and explainability.
The consequence for product teams is that technical quality has become mandatory. Products that ship with known stability issues, unclear failure modes, or integration gaps struggle to gain traction. Buyers in all categories prefer products that work consistently.
These three forces converge to define 2026 as a turning point: expectations for production-grade systems, financial accountability, and buyer prioritization of reliability. Products succeed by demonstrating operational maturity, cost discipline, and integration readiness from the start. Companies that adapt their development processes to these realities position themselves to capture market share in an environment where technical quality and financial sustainability carry equal weight.
Cross-industry trends shaping product decisions in 2026
Product development operates within a context defined by technology maturity, regulatory frameworks, and operational economics. Three patterns have emerged across industries that directly affect how products are architected, validated, and maintained. These patterns apply regardless of sector and influence decision-making at every stage of the product lifecycle.
Understanding these patterns helps product teams anticipate constraints, allocate resources appropriately, and make architectural choices that support long-term viability. The patterns reflect structural changes in how organizations evaluate, deploy, and govern technology systems.
AI in product development requires observability and governance
Artificial intelligence has transitioned from an experimental feature to a core system component. Organizations now integrate AI into production environments with the same rigor applied to databases, APIs, and other critical infrastructure. This transition changes how AI capabilities are implemented, monitored, and maintained.
According to McKinsey's 2025 State of AI report, 39% of organizations report measurable EBIT impact from AI use, with most reporting less than 5% of EBIT attributable to AI. The 6% of organizations classified as "high performers" commit more than 20% of their digital budgets to AI and are three times more likely to have senior leaders demonstrating ownership of AI initiatives.
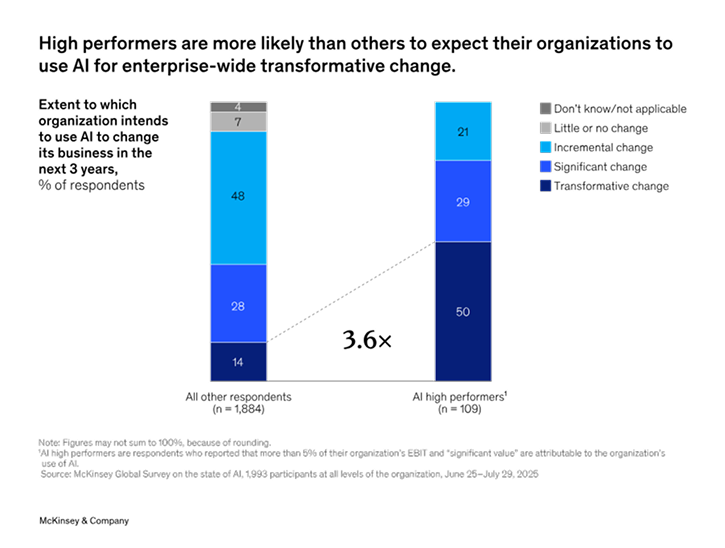
The distinction between high performers and other organizations lies in the implementation approach. High performers treat AI as infrastructure requiring human-in-the-loop validation processes, defined mechanisms for incorporating feedback, and well-defined KPIs for measuring adoption and ROI. These organizations redesign workflows around AI capabilities rather than adding AI features to existing processes.
Observability requirements have become standard. Products incorporating AI provide visibility into model behavior, decision paths, and confidence levels. This applies to both predictive models and generative AI systems. Users and operators need to understand when AI systems are operating within expected parameters and when they produce outputs that require human review.
Controllability extends beyond kill switches. Products implement granular controls that allow operators to adjust model behavior, set confidence thresholds, and define fallback mechanisms. In production environments, the ability to constrain AI behavior within defined boundaries matters more than maximizing performance in isolated metrics.
Explainability addresses technical and regulatory requirements. Systems provide context for AI-generated outputs, whether through attention mechanisms, feature importance scores, or natural language explanations. This capability supports debugging, compliance documentation, and user trust. In regulated industries, explainability documentation must satisfy auditors and regulatory bodies.
Despite widespread adoption at 88% of organizations, 74% struggle to scale AI beyond pilot phases. The pilot-to-scale transition remains a bottleneck. Organizations that succeed in scaling AI implement comprehensive governance frameworks, establish platforms that support multiple use cases, and invest in teams capable of operating AI systems in production.
Regulatory compliance influences product architecture and system design
Regulatory requirements now inform architectural decisions from initial design through deployment. Compliance frameworks dictate data handling practices, model governance procedures, and documentation standards. Products built without these considerations face costly retrofitting or market access restrictions.
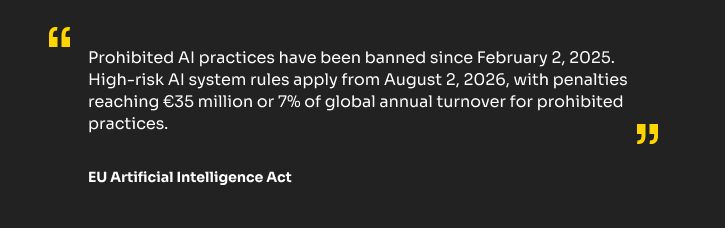
The EU AI Act establishes a compliance timeline that affects product roadmaps. Prohibited AI practices have been banned since February 2, 2025. High-risk AI system rules apply from August 2, 2026, with penalties reaching €35 million or 7% of global annual turnover for prohibited practices. Organizations operating in or selling to EU markets integrate these requirements into product specifications.
Compliance requirements include AI system inventories with risk classification, technical documentation, data protection measures, human oversight mechanisms, and quality management systems. High-risk AI systems require fundamental rights impact assessments. These requirements translate into product features, development processes, and operational procedures.
Data governance frameworks extend beyond privacy regulations. Products implement data lineage tracking, consent management, and purpose limitation controls. In healthcare, finance, and other regulated sectors, data handling practices must satisfy multiple regulatory regimes simultaneously. Architecture decisions account for data residency requirements, cross-border transfer restrictions, and retention policies.
User flows incorporate consent mechanisms, transparency disclosures, and preference management. Products disclose AI-generated content, provide explanations for automated decisions, and offer mechanisms for human review. These requirements affect interface design, workflow structure, and system capabilities.
System boundaries are defined by regulatory scope. Products clarify which components constitute high-risk AI systems, which data processing activities require specific controls, and which user interactions trigger compliance obligations. Clear boundary definition supports both technical implementation and legal documentation.
Operational efficiency and cost visibility drive technical decisions
Organizations evaluate products based on total cost of ownership, operational complexity, and maintenance burden. Feature richness has become secondary to operational predictability. This prioritization affects feature scoping, technology selection, and architecture patterns.
Cost visibility requirements have intensified. With cloud spending reaching $723.4 billion in 2025, organizations implement FinOps practices to track, allocate, and optimize infrastructure costs. Products that consume cloud resources provide detailed cost breakdowns, enable resource tagging, and support cost allocation to business units or projects.
Research indicates that 28-35% of cloud resources remain idle or underutilized. Companies implementing structured cost optimization programs achieve 25-30% reductions in monthly expenditure. Products contribute to these optimization efforts through efficient resource utilization, automatic scaling based on actual demand, and clear visibility into resource consumption patterns.
Long-term maintainability influences technology choices. Teams evaluate dependencies, update frequencies, and support lifecycles. Products built with widely adopted, well-documented technologies reduce maintenance overhead. Custom implementations or emerging technologies require stronger justification based on business value.
Operational efficiency extends to observability and debugging. Products provide structured logging, distributed tracing, and performance metrics. When issues occur, operators need rapid diagnosis and clear remediation paths. Products that require extensive manual investigation or custom tooling to troubleshoot create operational friction.
Integration patterns affect operational complexity. Products that support standard protocols, provide well-documented APIs, and follow common authentication patterns reduce integration effort. Organizations operating multiple products value consistency in operational interfaces, monitoring approaches, and deployment patterns.
The focus on operational efficiency creates a preference for proven patterns over novel approaches. Innovation occurs within boundaries defined by operational constraints. Products that introduce operational complexity must demonstrate proportional business value to justify the additional operational burden.
These three patterns (AI as production infrastructure, regulatory influence on architecture, operational efficiency prioritization) define the context for product development in 2026. Products succeed by addressing these patterns directly through architectural choices, feature prioritization, and operational design. The patterns apply across industries, though specific implementations vary by sector and regulatory environment.
Healthcare: AI governance and production-ready systems
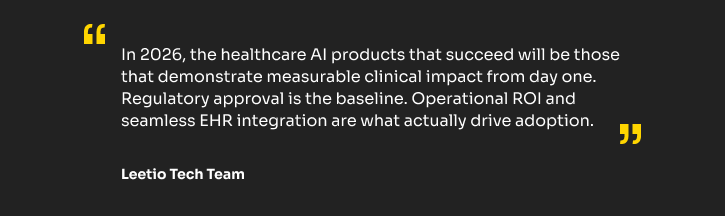
Healthcare AI has entered a phase where regulatory approval, clinical validation, and operational integration define market viability. The industry has moved from proof-of-concept demonstrations to systems that must function reliably within complex clinical workflows, satisfy stringent regulatory requirements, and demonstrate measurable patient outcomes.
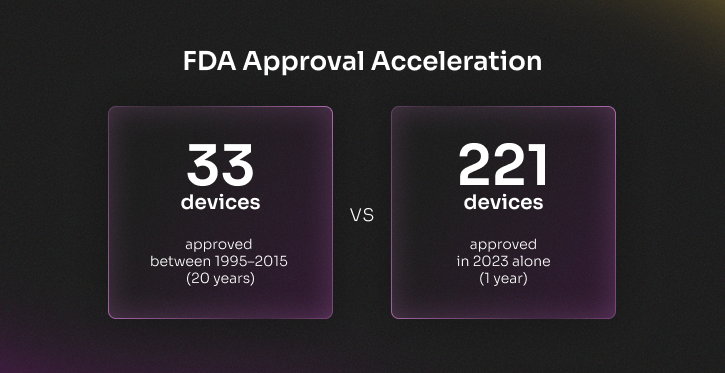
The FDA maintains a registry of AI-enabled medical devices, which reached 950 authorized devices as of August 2024. Between 1995 and 2015, 33 devices were approved. In 2023 alone, 221 devices received authorization, demonstrating the acceleration in regulatory clearance rates. Approximately 100 new AI medical devices receive approval annually, with radiology accounting for 76% of all authorized devices.
This growth reflects technology maturity and regulatory infrastructure development. The FDA has established frameworks for evaluating AI medical devices, including guidance on predetermined change control plans and transparency requirements. These frameworks address challenges specific to AI systems, including continuous learning, model updates, and performance monitoring in clinical settings.
Clinical validation and operational requirements drive healthcare AI adoption
Clinical validation requirements have evolved beyond traditional accuracy metrics. Regulatory bodies increasingly require evidence of real-world clinical impact, including effects on patient outcomes, workflow efficiency, and care delivery quality. Analysis of FDA-approved AI devices shows that clinical performance studies were reported for 55.9% of approved devices, while 24.1% explicitly stated no such study had been conducted. Among devices with clinical studies, retrospective evaluations accounted for 38.2%, prospective studies 8.1%, and randomized clinical trials 2.4%.
The validation gap presents challenges for product teams. Devices demonstrating strong performance in controlled testing environments may encounter different results in clinical practice due to variations in patient populations, clinical workflows, and data quality. Regulatory bodies have signaled intention to increase emphasis on clinical outcome data rather than purely algorithmic performance metrics.
Operational requirements extend beyond regulatory approval. Healthcare products must integrate with existing IT infrastructure, support clinical workflows without creating bottlenecks, and provide value that justifies implementation costs. Hospitals and health systems evaluate AI products based on measurable impact on efficiency, quality metrics, and financial performance.
Clinical documentation represents a category where operational requirements are well-defined. Physicians spend one hour on documentation for every five hours of patient care. Ambient clinical documentation AI achieves measurable ROI, with industry benchmarks indicating 5:1 returns on implementation costs. Current adoption stands at 35% of healthcare organizations, with expectations of 40% adoption within three years.

Market dynamics reflect the prioritization of operational value. Healthcare providers increasingly require AI products to demonstrate clear paths to reimbursement, integration timelines measured in weeks, and training requirements that fit within existing staff workflows. Products that create operational complexity or require extensive custom configuration face adoption barriers.
Compliance frameworks drive explainability and auditability in design
Explainability requirements in healthcare differ from general AI applications. Clinical decisions require documentation that supports medical reasoning, enables oversight by qualified practitioners, and satisfies legal standards for the standard of care. AI systems must provide context for their outputs in formats that clinicians can evaluate and incorporate into clinical judgment.
Regulatory frameworks mandate transparency at multiple levels. The FDA requires documentation of model development processes, training data characteristics, performance testing results, and intended use conditions. This documentation enables regulatory review and supports institutional evaluation during procurement decisions. Products that fail to provide comprehensive technical documentation face rejection during institutional vetting processes.
Auditability addresses accountability requirements. Healthcare institutions must demonstrate that AI-assisted decisions can be reconstructed and reviewed retrospectively. This supports quality assurance programs, medicolegal review, and continuous performance monitoring. Products implement audit logging that captures model versions, input data, confidence scores, and outputs generated during clinical use.
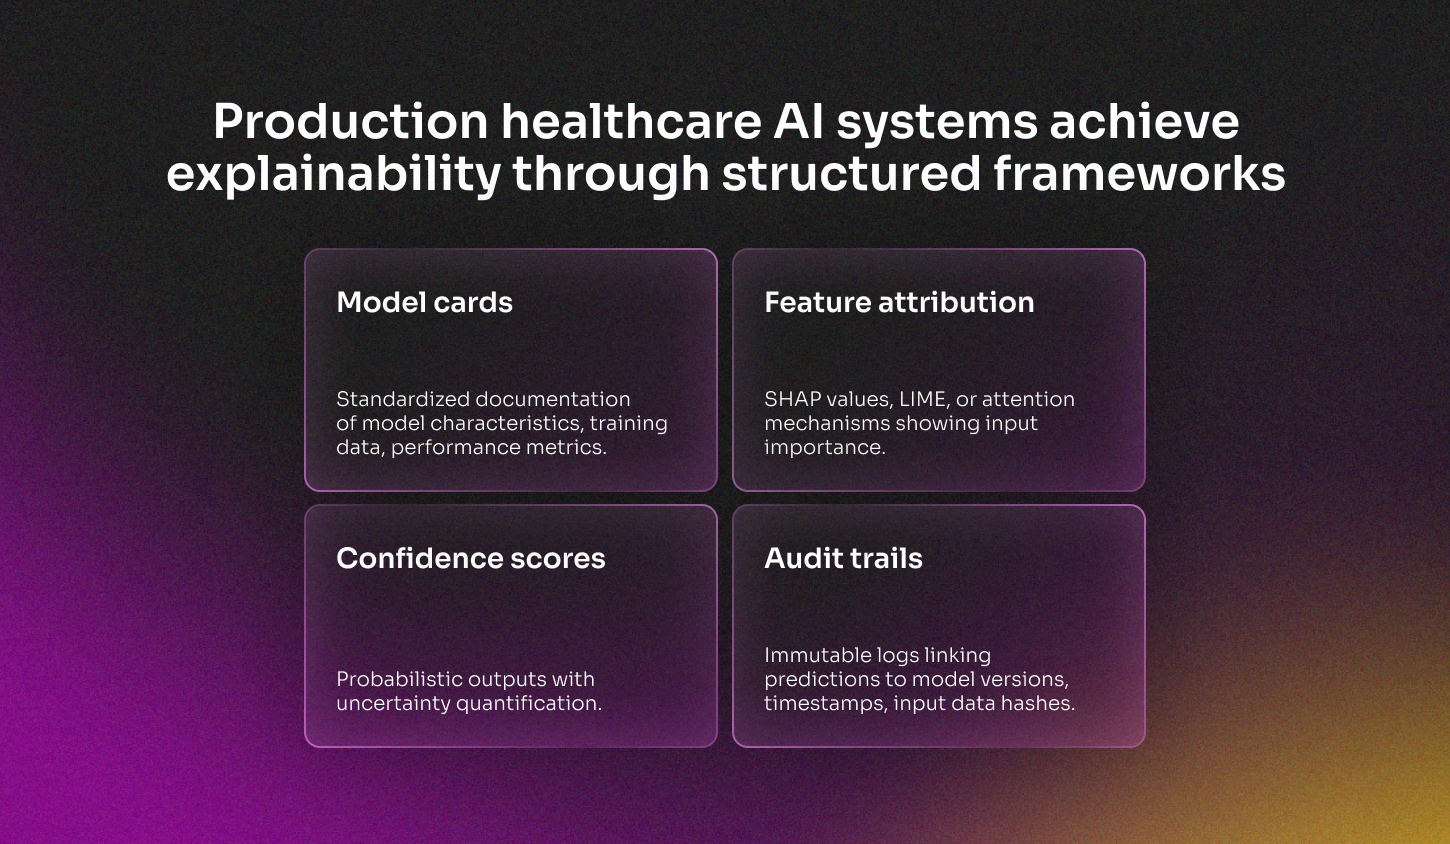
Traceable decision logic enables clinical oversight. Products provide mechanisms for clinicians to understand which features or data points influenced model outputs. In diagnostic applications, this might include attention maps highlighting relevant image regions. In risk prediction tools, this includes feature importance scores showing which patient characteristics drove the prediction.
The FDA has signaled increased scrutiny of algorithmic bias and model generalizability. Future guidance is expected to address demographic representation in training data, performance testing across patient subgroups, and ongoing monitoring requirements. Products developed without attention to bias assessment and mitigation face regulatory challenges and institutional resistance.
Human-in-the-loop workflows and EHR integration determine adoption
Human-in-the-loop design acknowledges that AI functions as a tool supporting clinical judgment. This principle applies across use cases, from diagnostic support to treatment planning. Products implement workflows where AI outputs are presented to qualified clinicians who make final decisions based on comprehensive patient context.
The human-in-the-loop requirement affects interface design, alert systems, and decision presentation. Products avoid automation bias by presenting outputs with appropriate uncertainty indicators, supporting easy override mechanisms, and documenting when clinician decisions diverge from AI recommendations.
EHR integration determines operational viability. Healthcare organizations operate on EHR platforms from vendors including Epic, Cerner, and Meditech. Products must exchange data with these systems using standard protocols (HL7 FHIR), minimize manual data entry, and present information within existing clinical workflows.

Major EHR vendors have begun embedding AI capabilities natively into their platforms. This creates competitive pressure for standalone AI products while establishing expectations for integration depth. Products that achieve tight EHR integration benefit from reduced implementation friction, automatic access to clinical data, and seamless incorporation into existing workflows.
Implementation timelines matter for healthcare IT departments. Organizations prefer products with standard integration patterns, clear technical requirements, and implementation timelines measured in weeks. Products requiring custom development, extensive configuration, or long deployment cycles face scrutiny during procurement.
Healthcare AI product development in 2026 requires simultaneous attention to regulatory compliance, clinical validation, and operational integration. Products succeed by demonstrating measurable clinical value, providing transparency and auditability, and integrating seamlessly with existing clinical workflows. Organizations that understand these requirements at the design stage position their products for regulatory approval and market adoption.
Fintech: Compliance architecture and infrastructure consolidation
Financial technology operates within an environment where regulatory compliance defines product architecture, infrastructure decisions, and go-to-market strategies. The sector has transitioned from regulatory arbitrage opportunities to alignment with traditional financial institution standards. Compliance requirements influence every layer of the technology stack, from data handling to API design.
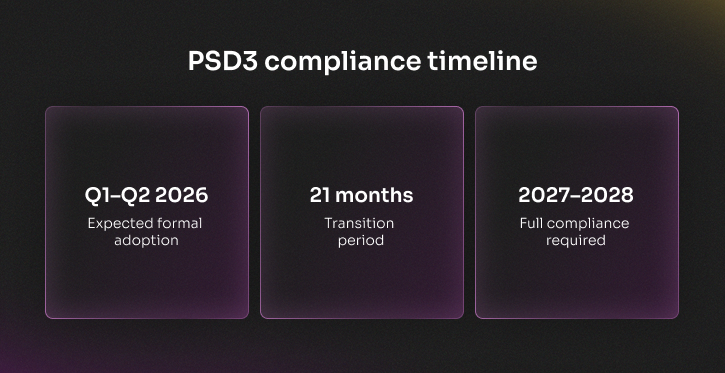
The regulatory environment continues to evolve. The EU Payment Services Directive 3 (PSD3) and Payment Services Regulation (PSR) reached provisional agreement in November 2025, with formal adoption expected in Q1-Q2 2026. Following a 21-month transition period, full compliance will be required by 2027-2028. This timeline affects product roadmaps, infrastructure investments, and operational planning across the sector.
Regulatory requirements define fintech product architecture from the design stage
Regulatory requirements influence architectural decisions from the initial design. PSD3 introduces enhanced consumer protection measures, expanded scope for emerging payment technologies, including blockchain and digital wallets, strengthened fraud-prevention requirements, and contactless payment regulations. These requirements translate into specific technical implementations.
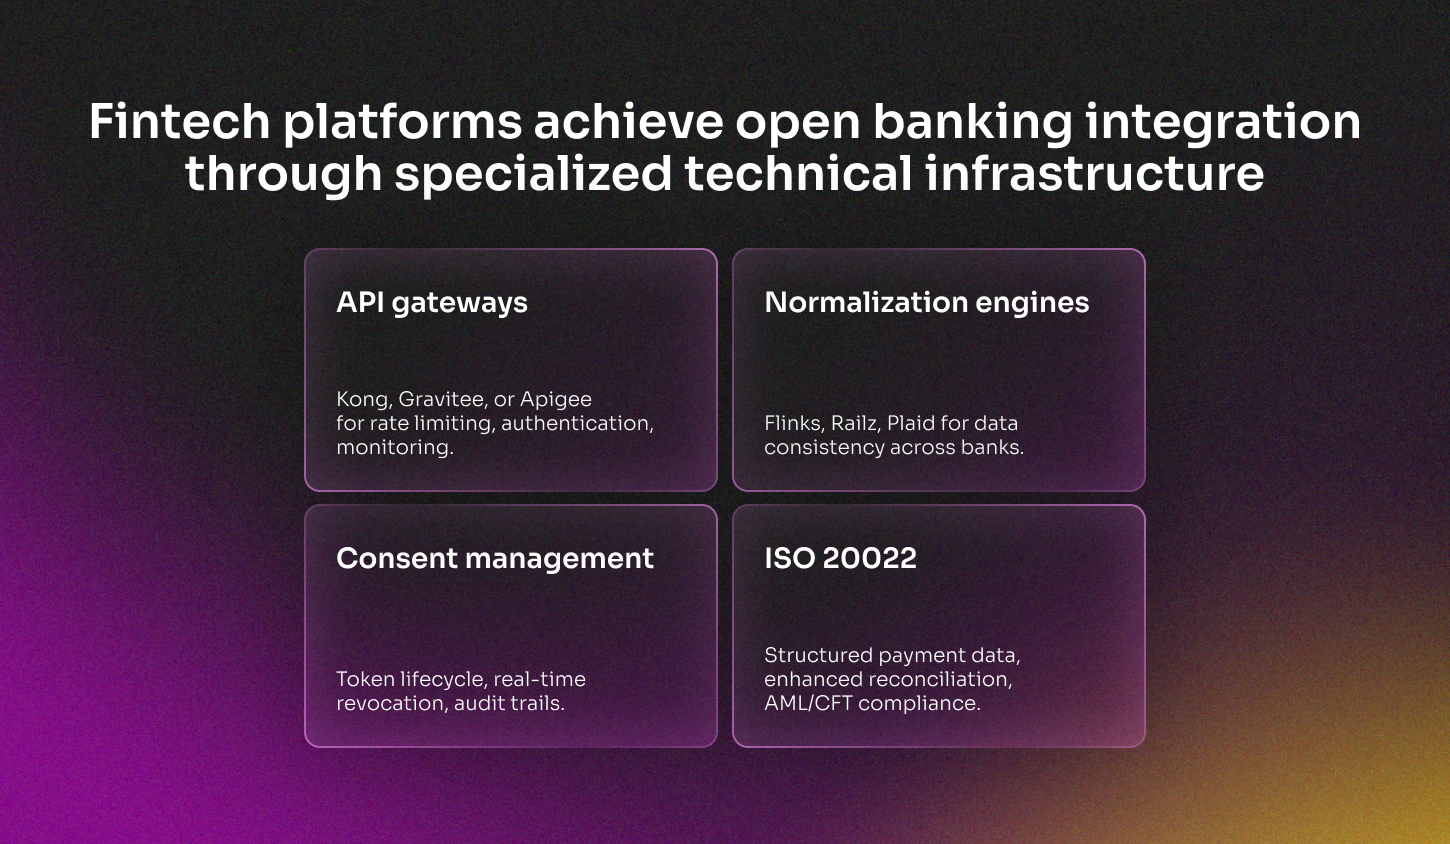
Data flows must accommodate regulatory mandates for transparency, consent management, and cross-border restrictions. Products implement mechanisms for real-time consent revocation, detailed audit trails, and secure data handling that satisfy multiple regulatory regimes simultaneously. The DORA (Digital Operational Resilience Act) established unified operational resilience standards across banking, securities, insurance, and payment services, requiring comprehensive incident reporting and infrastructure monitoring.
System boundaries are defined by regulatory classification. Products clarify which services require payment institution licensing, which qualify for e-money institution status, and which fall under cryptocurrency regulations. The merging of the E-Money Directive into PSD3 simplifies licensing for fintech issuers of wallets and prepaid cards, allowing payment institutions to issue e-money under a single regime.

User interactions reflect compliance obligations. Strong Customer Authentication (SCA) requirements dictate authentication flows, payment verification processes include mandatory payee name and IBAN checks, and fraud detection systems must share information with other payment service providers. These requirements affect interface design, user experience, and operational workflows.
API infrastructure must support regulatory technical standards. Open banking APIs comply with performance requirements, provide mandatory dashboards for monitoring, and implement standardized data formats. The ISO 20022 migration, with complete phase-out of legacy formats in 2026, requires reengineering of payment processing systems to support enhanced transaction data, improved reconciliation, and global interoperability.
Fintech products align with banking reliability standards
The distinction between fintech companies and traditional financial institutions has narrowed. Regulatory frameworks apply similar standards to banks and non-bank payment service providers, establishing consistency in consumer protections, operational resilience requirements, and security measures. This leveling creates competitive dynamics based on execution quality rather than regulatory arbitrage.
Reliability expectations match those of established financial infrastructure. Users anticipate 24/7 availability, instantaneous transaction processing, and immediate error resolution. Real-time payment systems, including FedNow, SEPA Instant, UPI, and PIX, have established baseline expectations for settlement speed. Products must support real-time liquidity management, instant refunds, and event-based pricing while maintaining operational stability.
Risk management frameworks mirror banking standards. Products implement Know Your Customer (KYC) processes, Anti-Money Laundering (AML) monitoring, fraud detection systems, and transaction screening. Regulatory bodies expect fintech companies to maintain risk-management capabilities comparable to those of traditional banks, including board-level oversight, dedicated compliance functions, and regular third-party audits.
Operational resilience requirements have become stringent. DORA mandates comprehensive incident reporting, business continuity planning, and ICT risk management. Products must demonstrate resilience to cyberattacks, system failures, and operational disruptions. This includes redundant infrastructure, disaster recovery capabilities, and documented recovery time objectives.
Infrastructure consolidation reduces operational complexity
Organizations consolidate infrastructure to reduce operational overhead, improve auditability, and control long-term costs. The proliferation of microservices, third-party integrations, and compliance tools has created complexity that affects reliability, increases operational burden, and complicates troubleshooting.
Consolidation manifests in multiple forms. Companies reduce the number of third-party service providers, standardize on fewer technology platforms, and centralize compliance monitoring. This reduces integration points, simplifies vendor management, and creates consistent operational interfaces across services.
Auditability requirements drive infrastructure decisions. Regulators expect detailed logging, transaction traceability, and clear accountability for system behavior. Distributed architectures with numerous components create audit challenges. Consolidated infrastructure with centralized logging, unified monitoring, and clear data lineage simplifies regulatory reporting and compliance demonstration.
Cost control pressures intensify consolidation. Organizations evaluate the total cost of ownership across infrastructure, licensing, operational overhead, and compliance burden. Products that integrate multiple functions reduce licensing costs, simplify operations, and decrease the specialized expertise required for maintenance.
Traditional financial institutions provide infrastructure services to fintech companies. Banks offer Banking-as-a-Service platforms that include compliance frameworks, payment processing, and regulatory reporting. Fintech companies leverage these platforms to reduce infrastructure development costs, accelerate time to market, and inherit compliance capabilities.
The convergence between banks and fintech companies creates collaboration patterns. Banks modernize through fintech partnerships, gaining agility and product innovation capabilities. Fintech companies gain access to banking infrastructure, regulatory expertise, and customer trust. This collaboration reduces the need for fintech companies to build a complete financial infrastructure independently.
Market consolidation through mergers and acquisitions reflects these dynamics. Companies acquire complementary capabilities to create integrated platforms, reduce operational complexity, and achieve economies of scale. Investors favor companies demonstrating clear paths to operational efficiency and sustainable unit economics over those pursuing market share through subsidized pricing.
Fintech product development in 2026 operates within constraints defined by comprehensive regulatory frameworks, reliability expectations matching traditional banking, and pressure to consolidate infrastructure. Products succeed by embedding compliance into architecture, meeting banking-grade reliability standards, and demonstrating operational efficiency through consolidated infrastructure approaches. Companies that recognize these requirements early and design accordingly position themselves for regulatory approval, market adoption, and long-term viability.
EdTech: Outcome-focused learning systems and measurable impact
Educational technology has transitioned from content delivery platforms to outcome-focused learning systems. Organizations purchasing EdTech products evaluate them based on measurable learning outcomes, skills development metrics, and demonstrated impact on learner performance. The industry has moved from growth-at-all-costs models to sustainable business operations with clear value propositions.
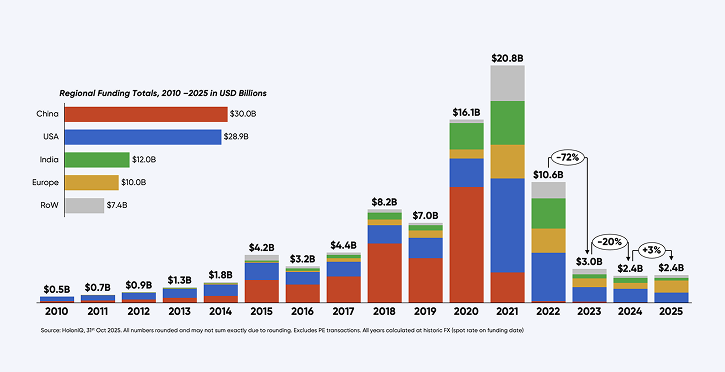
The global EdTech market reached $404 billion in 2025, representing 5.2% of the $7.3 trillion global education market. Venture capital investment reached $2.4 billion in 2025, recovering from $1.8 billion in 2024 (the lowest since 2014). The market demonstrates disciplined investment focused on profitability rather than speculative growth.

Skills development and learning outcomes drive EdTech procurement decisions
Procurement decisions prioritize evidence of learning outcomes over feature lists. Educational institutions and corporate learning departments require products to demonstrate measurable impact on learner performance, skill acquisition, and knowledge retention. Skills (durable, foundational, career-aligned) have become procurement filters, replacing content volume as the primary evaluation criterion.
Workforce learning dominates investment and adoption. More than 33% of the EdTech 1000 cohort focuses on workforce learning, reflecting sustained demand for job-relevant, short-cycle learning. Corporate L&D leaders expect AI to improve outcomes: 49% believe AI will improve talent development, 50% expect enhanced program scalability, and 53% believe AI will make training more adaptive to individual needs.
The gap between expectation and organizational readiness persists. Only 36% of L&D organizations report that leaders recognize AI importance in strategy, and only 42% report strong support for employee AI experimentation. This gap affects product adoption, as products requiring organizational change management face longer sales cycles.

Products implement outcome tracking mechanisms. Learning management systems integrate with assessment platforms, skills tracking tools, and performance management systems. Organizations evaluate EdTech products on their ability to provide data demonstrating skill progression, competency achievement, and knowledge application in work contexts.
AI integration drives workflow efficiency and instructional quality in EdTech
Artificial intelligence in education has moved from experimentation to governed deployment. The AI in education market reached $5.88 billion in 2024, with projections indicating $32.27 billion by 2030 at a 31% CAGR. AI-powered tools are embedded into the core educational infrastructure rather than deployed as standalone features.
Workflow efficiency applications address educator's administrative burden. Products automate lesson planning, assessment creation, grading, and progress reporting. Platforms like Magic School AI and Brisk Teaching reduce time spent on repetitive tasks, allowing educators to focus on instruction and student interaction. These tools demonstrate measurable time savings that translate to cost justification in procurement decisions.
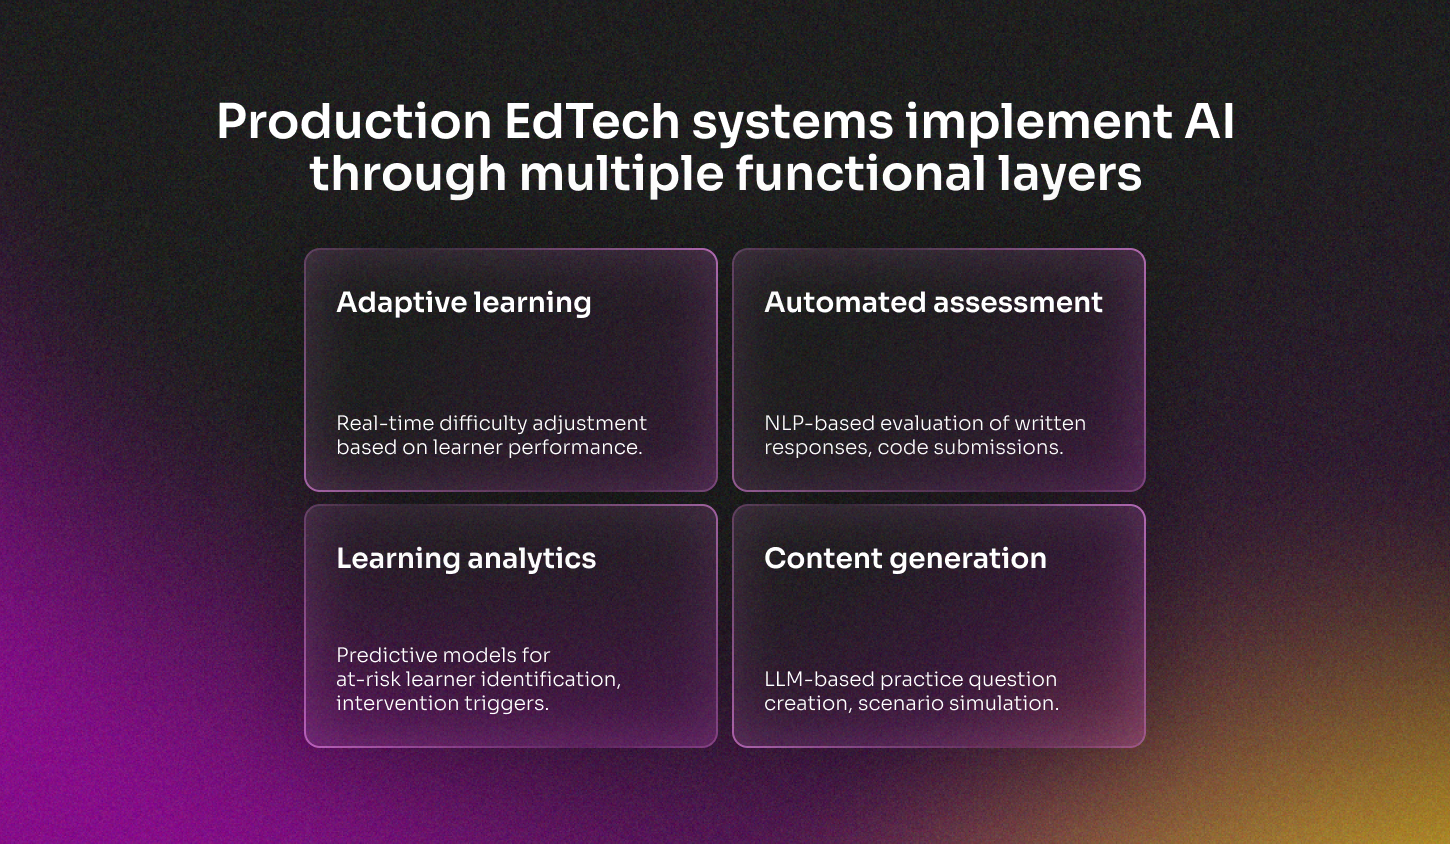
Instructional quality improvements leverage AI for personalization. Intelligent tutoring systems adapt content difficulty, pacing, and presentation based on learner performance. These systems provide immediate feedback, identify knowledge gaps, and recommend targeted interventions. Products demonstrate effectiveness through improved learning outcomes compared to traditional instruction methods.
Learner support tools address accessibility, engagement, and comprehension. AI-powered assistants answer learner questions, provide contextual help, and offer study guidance. Career navigation platforms use AI to match learner skills with career paths, recommend relevant courses, and identify skill gaps. These tools support learner autonomy while providing structured guidance.
Governance frameworks address AI deployment concerns. Educational institutions require transparency in AI decision-making, protection of learner data, and mechanisms for identifying algorithmic bias. Products provide explainability features, data privacy controls, and audit trails for AI-generated content and recommendations.

Market consolidation and infrastructure decisions drive EdTech investment
Investment patterns reflect market maturation. M&A activity reached approximately 360 transactions in 2025, concentrated in systems, infrastructure, and job-aligned upskilling platforms. Eight IPOs occurred in 2025, demonstrating conservative appetite and valuation discipline. Investors favor companies with clear paths to profitability over those pursuing market share through subsidized pricing.
Infrastructure consolidation addresses interoperability challenges. Educational institutions operate multiple systems for learning management, student information, assessment, and administrative functions. Products that integrate across these systems reduce operational complexity, improve data flow, and create unified learner experiences. Shared data standards and API-first architectures enable this integration.
Regional investment patterns vary significantly. Europe led EdTech investment in 2025, approaching 50% of global venture capital value. This represents a significant change from historical patterns, where China dominated with 60% of global EdTech VC in 2020. Regional priorities reflect demographic challenges: aging populations in East Asia drive investment in AI productivity tools, while Europe focuses on vocational expansion and short-cycle credentials.
The funding environment demands clear value propositions. Products must demonstrate unit economics, customer retention, and revenue growth trajectories. Venture capital investment at $2.4 billion in 2025 represents recovery from 2024 lows but remains significantly below 2021 peaks. This disciplined environment favors companies with proven business models over experimental approaches.
Corporate learning budgets prioritize measurable ROI. Organizations evaluate EdTech products based on cost per learner, time to competency, and business impact metrics. Products that connect learning outcomes to business results (productivity improvements, quality metrics, safety records) gain a procurement advantage over those demonstrating only engagement or completion rates.
EdTech product development in 2026 requires focus on measurable learning outcomes, governed AI deployment, and infrastructure interoperability. Products succeed by demonstrating clear skills progression, providing workflow efficiency for educators, and integrating seamlessly with existing educational infrastructure. Companies that align product development with these priorities position themselves for adoption in a market characterized by disciplined investment and outcome-focused procurement.
SaaS: Unit economics, operational efficiency, and pricing model evolution
Software-as-a-Service businesses operate in an environment where unit economics determine viability, operational efficiency drives valuation, and pricing models evolve to align with customer value realization. The market has transitioned from growth-at-all-costs to sustainable business operations with clear paths to profitability.
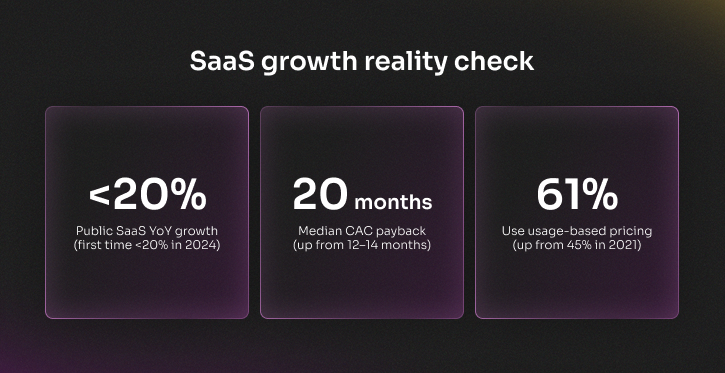
Growth rates reflect market maturation. Median year-over-year growth for public SaaS companies fell below 20% for the first time in 2024. Private SaaS companies with less than $1M ARR maintain 50% median growth, while those exceeding $20M ARR achieve 25% median growth. This graduation reflects increasing customer acquisition costs, market saturation in certain segments, and heightened competition.
Customer retention and CAC payback define SaaS product viability
Customer acquisition costs have increased significantly. Median CAC payback periods reached 20 months in 2025, extending from historical ranges of 12-14 months. This extension reflects higher marketing costs, longer sales cycles, and increased competition for customer attention. Products must demonstrate clear value propositions and ROI to justify extended payback periods.
Retention metrics determine long-term viability. Top-performing companies achieve 115-125% Net Revenue Retention (NRR), while public SaaS median NRR hovers around 110%. Companies aligning pricing with customer outcomes experience 40% lower churn rates. Organizations with dedicated Customer Success Managers achieve up to 25% higher NRR compared to those without structured customer success functions.
Churn patterns vary by company size and customer segment. Companies exceeding $10M in revenue maintain average annual churn of 8.5%, while those below $10M often experience churn exceeding 20%. Enterprise-focused solutions achieve 8-10% higher NRR than SMB-focused products, reflecting greater customer stability and expansion revenue opportunities in enterprise segments.
Onboarding quality directly impacts retention. More than 20% of voluntary churn links to poor onboarding experiences. Products that reduce time-to-value, provide clear activation milestones, and demonstrate ROI during initial usage periods achieve higher retention rates. Onboarding must be treated as a product feature rather than a post-sale activity.
Operational efficiency and cost visibility drive infrastructure decisions
Cloud infrastructure costs represent significant operational expenses. Organizations identify rising cloud costs as their top challenge, with 48% citing this concern. Idle and underutilized resources account for 28-35% of total cloud spending, while only 23% of organizations consider themselves highly efficient in cost management.
Cost optimization programs demonstrate measurable impact. Companies implementing structured optimization achieve 25-30% reductions in monthly cloud spending. Automated governance tools provide up to 20% annual savings, while reserved instance and savings plan adoption yields 37% cost reductions. Despite these benefits, only 49% of organizations actively manage reserved pricing agreements.
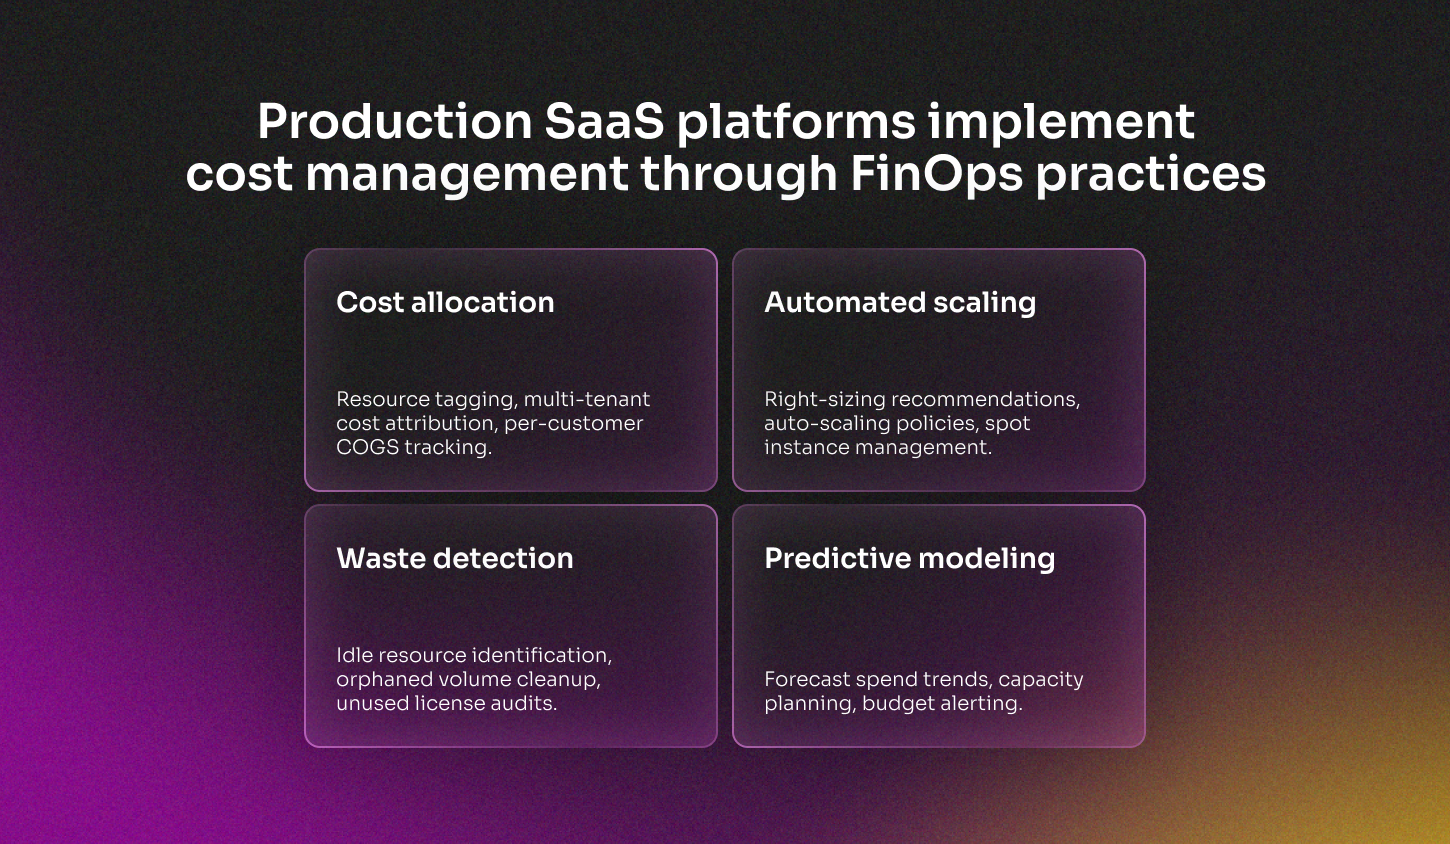
FinOps adoption accelerates across enterprises. 72% of large enterprises use cloud cost dashboards, with FinOps automation expected to reach 75% enterprise adoption by 2026. Predictive cost modeling capabilities will reduce overspend by 40% in mature organizations. SaaS products that provide built-in cost visibility and optimization capabilities gain a competitive advantage.
Infrastructure decisions balance performance, reliability, and cost. Products optimize database query patterns, implement caching strategies, and leverage content delivery networks to reduce compute and bandwidth costs. Architecture choices that enable horizontal scaling and multi-tenancy efficiency directly impact unit economics.
Pricing model evolution toward usage-based and hybrid approaches
Usage-based pricing adoption has accelerated significantly. 61% of SaaS companies now implement usage-based pricing, increasing from 45% in 2021. An additional 85% have either adopted or are testing usage-based pricing models. This transition reflects alignment with customer value realization and reduced barriers to initial adoption.
Performance data supports usage-based models. Companies employing usage-based pricing achieve 38% faster revenue growth compared to traditional subscription models, with 54% higher growth rates at scale. These companies maintain 10% higher NRR and experience 22% lower churn rates. Overall growth rates double compared to subscription-only models.
Hybrid pricing models combine subscription and usage components. 43% of SaaS companies implement hybrid approaches, while 86% of companies valued over $100M use at least three pricing dimensions. Companies employing multi-dimensional pricing models achieve 34% higher LTV/CAC ratios compared to single-dimension pricing.

API and infrastructure tools lead usage-based adoption, with 78% implementing consumption-based models in 2025. These products benefit from natural alignment between usage and value, as customers pay for actual consumption rather than estimated capacity. This model reduces customer risk and enables expansion of revenue as usage grows.
Pricing optimization requires continuous iteration. Companies updating prices every six months achieve 2x ARPU compared to those updating annually. This frequent optimization enables responsiveness to market conditions, competitive dynamics, and customer feedback. However, 42-73% of companies raised or plan to raise prices, with median increases around 20%, creating customer sensitivity that must be managed carefully.
SaaS inflation exceeds general market inflation at 8.7-11.4% year-over-year, compared to G7 market inflation of 2.7%. This differential creates pricing pressure as customers evaluate SaaS spending. Organizations face subscription fatigue, with 49% of SaaS licenses going unused on average. Products must demonstrate clear value to justify renewal and expansion.
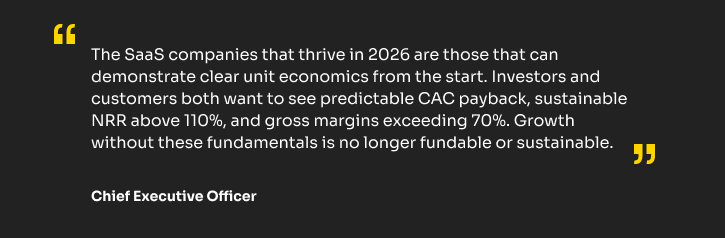
SaaS product development in 2026 requires focus on unit economics, operational efficiency, and pricing model evolution. Products succeed by demonstrating sustainable CAC payback periods, maintaining NRR above 110%, implementing cost-efficient infrastructure, and adopting pricing models that align with customer value realization. Companies that prioritize these fundamentals over growth-at-all-costs position themselves for long-term viability in a maturing market.
Final Thoughts
The patterns examined across healthcare, fintech, edtech, and SaaS reveal a fundamental recalibration in how digital products are conceived, built, and brought to market. This recalibration affects every decision point in the product development cycle, from initial architecture choices to pricing strategies and go-to-market execution.
Product teams operating in 2026 face constraints that previous cohorts could sidestep. Regulatory frameworks now influence technical implementation from day one. Cost optimization is embedded in architectural decisions rather than addressed post-launch. AI systems require observability and governance mechanisms before production deployment. These constraints are not temporary market conditions but structural changes that define the operating environment.
The opportunity exists for teams that recognize these constraints as design parameters rather than obstacles. Products built with regulatory compliance embedded in architecture achieve faster adoption cycles. Systems architected for cost efficiency from inception avoid the retrofitting burden that plagues competitors. AI implementations designed with observability and control mechanisms scale beyond pilot phases while others stall.
Market dynamics reward execution quality over feature velocity. Organizations purchasing enterprise software evaluate vendors on operational reliability, integration capabilities, and total cost of ownership. Investors fund companies demonstrating sustainable unit economics and clear paths to profitability. Users expect products that work consistently rather than products that ship frequently with incomplete features.
The distinction between experimental technology and production-grade systems has crystallized. Products that achieve production readiness from initial deployment gain a competitive advantage through reduced adoption friction and accelerated revenue realization. Those that treat production readiness as a post-launch concern face extended sales cycles and higher customer acquisition costs.
Success in this environment requires deliberate decision-making at every stage. Product scope must account for regulatory requirements, operational costs, and maintenance burden. Architecture choices must balance performance with efficiency and observability. Go-to-market strategies must demonstrate measurable value aligned with customer outcomes.
The turning point is irreversible. Digital product development has entered a phase where technical excellence, regulatory compliance, and financial sustainability are prerequisites rather than differentiators. Organizations that adapt their processes to this reality position themselves to build products that meet market demands and achieve sustainable growth.
FAQ
- Yes. Early-stage startups benefit from addressing these patterns at inception rather than retrofitting later. Building with regulatory compliance, cost-efficient architecture, and production-ready AI from day one avoids technical debt that constrains scaling. Startups demonstrating clear unit economics and operational maturity attract investment in an environment favoring sustainability over speculative growth.
- Non-technical founders must treat technical decisions as business decisions. Architecture choices affect unit economics and market access. Regulatory requirements influence timelines and feature scope. Establish decision frameworks that account for implementation costs, operational overhead, and maintenance burden alongside user value. Track metrics like infrastructure cost as a percentage of revenue and time-to-production-ready for features.
- AI functions as production infrastructure requiring observability, governance, and operational processes. Only 39% of organizations report measurable EBIT impact, with most under 5%. Success requires realistic expectations, comprehensive governance frameworks, and workflow redesign around AI capabilities. Products must provide explainability, controllability, and monitoring to scale beyond pilot phases.
- Regulatory requirements extend timelines but reduce post-launch rework. Products designed with compliance embedded from inception avoid costly retrofitting. Healthcare products follow FDA pathways with predictable timelines. Fintech products must account for PSD3 compliance by 2027-2028. Teams mitigate impact through parallel work streams, early regulatory engagement, and architecture supporting compliance requirements.
- Track operational sustainability alongside growth. For SaaS: CAC payback (20 months median), NRR (110% median, 115-125% for top performers), and infrastructure cost as a percentage of revenue. Industry-specific: healthcare tracks clinical validation and EHR integration; fintech monitors compliance coverage and reliability; edtech measures learning outcomes and adoption velocity. Leading indicators include the technical debt ratio and the mean time to recovery.
- Innovation occurs within operational constraints. Establish clear criteria for when features justify operational complexity. Innovate in implementation while maintaining proven architectural patterns. Organizations allocate specific capacity for experimental work (typically 20%) while protecting core stability (80%). Clear gates determine when experimental work transitions to production.
- Usage-based pricing shows clear impact: 61% adoption (up from 45% in 2021), achieving 38% faster revenue growth, 54% higher growth at scale, and 22% lower churn. Hybrid models combining subscription and usage components demonstrate 34% higher LTV/CAC ratios. Companies updating prices every six months achieve 2x ARPU compared to annual updates. Balance optimization against subscription fatigue (49% of licenses go unused).
CONTACT US

Sergii Kulikovskyi
Chief Executive Officer at Leetio
For detailed questions about products, their launch, or scaling.

Tanya Ivanishyna
Business Development Manager at Leetio
For questions about how our team can support you.
OUR OFFICE
Kaupmehe 7-120
10114 Tallinn
Estonia
C/ d'Aragó 562
Barcelona
Spain